Below code to list all instances across GCP Projects

PROJECTS=$(gcloud projects list --format="value(projectId)")

for PROJECT in ${PROJECTS}
do
  echo "Project: ${PROJECT}"
  # Extracts ACCOUNT_ID, EMAIL (==ACCOUNT_ID@...), DISABLED
  #ROBOTS=$(\
  #gcloud compute instances list --project=${PROJECT} --format="csv(name,disks[].guestOsFeatures[0].type[],networkInterfaces.networkIP)"
  gcloud compute instances list --project=${PROJECT}  --format="csv(name,disks.licenses.scope(licenses),networkInterfaces.networkIP,selfLink.scope(projects),status)"

done
The below code is to list all service account in GCP across all Projects
for PROJECT in ${PROJECTS}
do
  echo "Project: ${PROJECT}"
  # Extracts ACCOUNT_ID, EMAIL (==ACCOUNT_ID@...), DISABLED
  ROBOTS=$(\
    gcloud iam service-accounts list \
    --project=${PROJECT} \
    --format="csv[no-heading](displayName.encode(\"base64\"),email,email.split(\"@\").slice(0),disabled)")
  for ROBOT in ${ROBOTS}
  do
    # Parse results
    IFS=, read ENCODED_NAME EMAIL ACCOUNT_ID DISABLED <<< ${ROBOT}
    NAME=$(echo -e ${ENCODED_NAME} | base64 --decode)
    echo "  Service Account: ${NAME}"
    echo "    Disabled: ${DISABLED}"
    echo "    Email: ${EMAIL}"
    # Keys
    # KEYS=$(\
    #    gcloud iam service-accounts keys list \
    #    --iam-account=${EMAIL} \
    #    --project=${PROJECT} \
    #    --format="value(name.scope(keys))")
    #for KEY in ${KEYS}
    #do
    #  echo "    Key: ${KEY}"
    #done
 done
done
1.Either you can create a service account [1] or use another service account except the default one. Please make sure that it has the roles/dataflow.admin and roles/dataflow.worker roles.
2.If you want to create a DataFlow Job using the template in the DataFlow console, you need to click on “SHOW OPTIONAL PARAMETERS” once you select the template. After clicking on the “SHOW OPTIONAL PARAMETERS” , there you will find the “Service account email” option where you need to provide your specified service account name.Please go through attachment “template-job-service-account.pdf”.
3.If you want to create DataFlow job using Apache Beam Python API, please follow the below code snippet,
—– Use the –service_account_email option and specify your service account when you run your pipeline job: –service_account_email=your-desired-service-account-name@<project-id>.iam.gserviceaccount.com
4.If you want to create DataFlow job using Apache Beam JAVA API, please follow the below code snippet,
—- Use the –serviceAccount option and specify your service account when you run your pipeline job: –serviceAccount=your-desired-service-account-name@<project-id>.iam.gserviceaccount.com
Find the Service account Used by a Dataflow Job
1.Please go to the Cloud DataFlow. 2.Select the DataFlow Job. 3.Once you select any particular JOB, Job ID will appear in the right side pane. Please take the JobID. 4.Go to Cloud Logging and write the following query —-protoPayload.methodName=”dataflow.jobs.create” “2021-06-19_23_43_39-24388466012345644878” 5.Where “2021-06-19_23_43_39-24388466012345644878” is the sample JOB ID. You need give your JobID 6.Once the result will come, please click on it and then click on “expand nested fields” 7.The log will be opened as a JSON and do a check for the “request” part. It be look like “request”: { “job_name”: “product-hierarchy-bq-to-gcs-2021620_test”, “job_id”: “2021-06-19_23_43_39-243884660123456878”, “serviceAccount”: “777777777-example@developer.gserviceaccount.com”
Adding Project Owner Editor, Viewer Permission to bucket
When the Permission of the bucket is Access Control – Fine Grained
And the bucket doesn’t have Project Owner Editor, Viewer Permission to bucket a. “gsutil acl set private gs://ibucket name>” b. “gsutil acl ch -p editors-:O gs://” c. “gsutil acl ch -p viewers-:O gs://” project no – The Project number of the project (get it from the dashboard of the project) bucket name – The Name of the bucket
n this lab, you investigate Google Cloud Audit Logging. Cloud Audit Logging maintains two audit logs for each project and organization: Admin Activity and Data Access. Google Cloud Platform services write audit log entries to these logs to help you answer the questions of “who did what, where, and when?” within your Google Cloud Platform projects.
Objectives
Task 1. Enabling data access audit logs
Data Access audit logs (except for BigQuery) are disabled by default. You will first enable all audit logs. Logging charges for the volume of log data that exceeds the free monthly logs allotment. All logs received by Logging count towards the logs allotment limit, except for the Cloud Audit Logging logs that are enabled by default. This includes all GCP Admin Activity audit logs, System Event logs plus GCP Data Access audit logs from Google BigQuery only.
On the Google Cloud Platform menu, click Activate Google Cloud Shell ( )to open Cloud Shell. If prompted, click Start Cloud Shell.
Once Cloud Shell is fully open, click on the pencil icon to open the Cloud Shell code editor and Cloud Shell SSH interface in a new tab.
In Cloud Shell, run the following command to retrieve the current IAM policy for your project and save it aspolicy.json:
In the Navigator pane, click on the policy.json file to open it in the editor.
Add the following text to the policy.json file to enable data Access audit logs for all services. This text should be added just after the first { and before"bindings": [ (Be careful not to change anything else in the file).
Admin Activity logs contain log entries for API calls or other administrative actions that modify the configuration or metadata of resources. For example, the logs record when VM instances and App Engine applications are created and when permissions are changed. To view the logs, you must have the Cloud Identity and Access Management roles Logging/Logs Viewer or Project/Viewer.
Admin Activity logs are always enabled so there is no need to enable them. There is no charge for your Admin Activity audit logs.
Using the Activity page
You can view abbreviated audit log entries in your project’s Activity page in the GCP Console. The actual audit log entries might contain more information than you see in the Activity page. The Activity page is good for a quick check of account activity.
Switching to the browser tab showing the GCP console, select Navigation menu > Home.
Click on the ACTIVITY button near the top left.
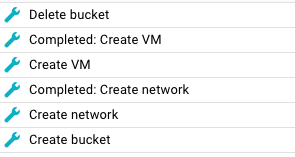
At the top of the activity table, you will see the activity you just generated:
If you do not see the activity, reload the page.
If the Filter pane is not displayed on the right, click theFilter button on the top right.
In the filter pane, click on the Activity types, clickSelect all, and click OK.
In the filter pane, click on the Resource type, UncheckSelect all checkbox, select GCE Network, and click OK. The Activity table now only shows the network that was created at the start of the lab.
Feel free to explore other filters to help locate specific events. Filters can help locate events or to verify which events occurred.
Using the Stackdriver Logging page
From the GCP console, select Navigation menu >Stackdriver > Logging.
Click the down arrow in the Filter by label or text search field and select Convert to advanced filter.
Delete the contents of the advanced filter field.
Paste the following in the advanced filter field and replace PROJECT_ID with your project ID. You can copy the PROJECT_ID from the Qwiklabs Connection Details:
Locate the log entry for when the cloud storage was deleted:
Within that entry, click on the Cloud Storage text and select Show matching entries.
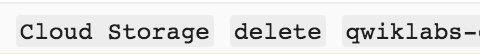
Notice a line was added to the advanced filter to show only storage events:
You should now see only the cloud storage entries.
Within the entry, click on the delete text and selectShow matching entries.
Notice another line was added to the advanced filter and now you can only see storage delete entries.
This technique can be used to easily locate desired events.
Expand the Cloud Storage delete entry and then expand the protoPayload field.
Expand the authenticationInfo field and notice you can see the email address of the user that performed this action.
Feel free to explore other fields in the entry.
Using the Cloud SDK
Log entries can also be read using the Cloud SDK command:
Example (Do not copy):
gcloud logging read [FILTER]
Switch to the browser with the Cloud shell.
Use the following command to retrieve just the audit activity for when storage buckets were deleted:
gcloud logging read \
"logName=projects/$DEVSHELL_PROJECT_ID/logs/cloudaudit.googleapis.com%2Factivity \
AND protoPayload.serviceName=storage.googleapis.com \
AND protoPayload.methodName=storage.buckets.delete"
Task 4. Exporting Audit logs
Audit log retention
Individual audit log entries are kept for a specified length of time and are then deleted. The Stackdriver Logging Quota Policy explains how long log entries are retained. You cannot otherwise delete or modify audit logs or their entries.
Audit log type
Retention period
Admin Activity
400 days
Data Access
30 days
For longer retention, you can export audit log entries like any other Stackdriver Logging log entries and keep them for as long as you wish.
Export audit logs
When exporting logs, the current filter will be applied to what is exported.
From the Stackdriver Logging dashboard, set the filter to display all the audit logs by deleting all lines in the filter except the first one. Your filter will look like (your project ID will be different):
Set the Sink destination to Create new BigQuery dataset, name the dataset auditlogs_dataset, and click the CREATE button.
Click the Create sink button.
Read the message in the Sink created dialog and clickCLOSE.
On the left side of the Stackdriver dashboard, click on the Exports option. This allows for export to be viewed or edited. You will see the export you just created.
On the right side, click the button with three dots for your export and select View Filter.
This will show the filter that was present when the export was created.
Click CLOSE when done.
In Cloud Shell, run the following commands to generate some more activity that you will view in the audit logs exported to BigQuery:
Go to Navigation menu > BigQuery. If prompted, log in with the Qwiklabs-provided credentials.
The Welcome to BigQuery in the Cloud Consolemessage box opens. This message box provides a link to the quickstart guide and lists UI updates.
Click Done.
In the left pane in the Resources section, click your project (this starts with qwiklabs-gcp-xxx) you should see an auditlogs_dataset dataset under it.
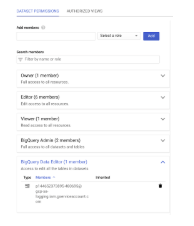
Verify that the BigQuery dataset has appropriate permissions to allow the export writer to store log entries. Click on the auditlogs_dataset dataset, then click on the Share dataset. On the Dataset Permission page you will see the service account as Bigquery Data Editor member. If it’s not already listed, you can add service account under Add members and grant data editor role.
Click the Cancel button to close the Share Datasetscreen.
Expand the dataset to see the table with your exported logs (click on dataset name to expand).
Click on the table name and take a moment to review the schemas and details of the tables that are being used.
Click the Query Table button.
Delete the text provided in the Query editor window and paste in the query below. This query will return the users that deleted virtual machines in the last 7 days:
#standardSQL
SELECT
  timestamp,
  resource.labels.instance_id,
  protopayload_auditlog.authenticationInfo.principalEmail,
  protopayload_auditlog.resourceName,
  protopayload_auditlog.methodName
FROM
`auditlogs_dataset.cloudaudit_googleapis_com_activity_*`
WHERE
  PARSE_DATE('%Y%m%d', _TABLE_SUFFIX) BETWEEN
  DATE_SUB(CURRENT_DATE(), INTERVAL 7 DAY) AND
  CURRENT_DATE()
  AND resource.type = "gce_instance"
  AND operation.first IS TRUE
  AND protopayload_auditlog.methodName = "v1.compute.instances.delete"
ORDER BY
  timestamp,
  resource.labels.instance_id
LIMIT
  1000
Click the RUN button. After a couple seconds you will see each time someone deleted a virtual machine within the past 7 days. You should see a single entry, which is the activity you generated in this lab. Remember, BigQuery is only showing activity since the export was created.
Delete the text in the Query_editor window and paste in the query below. This query will return the users that deleted storage buckets in the last 7 days:
#standardSQL
SELECT
  timestamp,
  resource.labels.bucket_name,
  protopayload_auditlog.authenticationInfo.principalEmail,
  protopayload_auditlog.resourceName,
  protopayload_auditlog.methodName
FROM
`auditlogs_dataset.cloudaudit_googleapis_com_activity_*`
WHERE
  PARSE_DATE('%Y%m%d', _TABLE_SUFFIX) BETWEEN
  DATE_SUB(CURRENT_DATE(), INTERVAL 7 DAY) AND
  CURRENT_DATE()
  AND resource.type = "gcs_bucket"
  AND protopayload_auditlog.methodName = "storage.buckets.delete"
ORDER BY
  timestamp,
  resource.labels.instance_id
LIMIT
  1000
Click the RUN button. After a couple seconds you will see entries showing each time someone deleted a storage bucket within the past 7 days.
Task 6. Finish up
Review
In this lab, you had the chance to do the following:
Create a Stackdriver account used to monitor several GCP projects
Create a metrics dashboard
Task 1. Set up resources in your first project
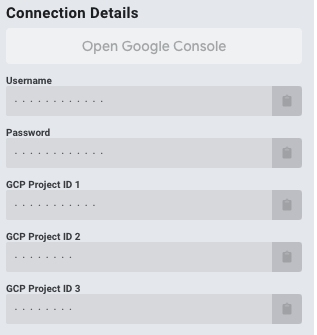
In the Qwiklabs Connection Details section, you will see three projects listed. The first and second projects will contain active GCP resources which will generate logs and monitoring metric data. The third project will contain your Stackdriver account configuration data. Your Connection Details will look similar to below, but will display actual values:
In this step, you’ll create the GCP resources for the first project.
Locate the ID of the GCP Project ID 1 displayed in the Qwiklabs Connection details section. You will need this project ID shortly.
In the browser displaying the GCP console, open the resource manager page in the Google Cloud Console (Navigation menu > IAM & admin > Manage resources).
Click on the project with the ID that matches Project ID 1 displayed first in the Qwiklabs Connection Detailssection.
On the Google Cloud Platform menu, click Activate Cloud Shell () to open Cloud Shell. If prompted, click Start Cloud Shell.
Once Cloud Shell is fully open, click on the pencil iconto open the Cloud Shell code editor and Cloud Shell SSH interface in a new tab.
In Cloud Shell, download and unpack an archive that contains setup code:
curl https://storage.googleapis.com/cloud-training/gcpsec/labs/stackdriver-lab.tgz | tar -zxf -
Run the setup script to create resources:
cd stackdriver-lab
./setup.sh
The created resources will include:
Service accounts (for use by VMs)
Role assignments (granting service accounts permissions to write to Stackdriver)
A Linux VM with Apache and the Stackdriver agents installed
A Windows VM with the Stackdriver agents installed
A Kubernetes cluster with an Nginx deployment
A Pubsub Topic and Subscription
Once the setup script is done, run the activity generation script to create a background load on your Web servers and PubSub topic.
./activity.sh
Click Check my progress to verify the objective.
Set up resources in the first project
Check my progress
Task 2. Set up resources in your second project
Locate the ID of the GCP Project ID 2 displayed in the Qwiklabs Connection Details section. You will need this project ID in the next step.
You will now repeat the steps you used in Task 1, this time to set up resources in the second project:
Switch Cloud Shell to focus on project 2:
gcloud config set project <project-ID-2>
Run the setup script to create resources in project 2:
cd ~/stackdriver-lab
./setup.sh
Run the script to generate some activity on project 2:
./activity.sh
Switch the Cloud Shell back to project 1:
gcloud config set project <project-1-ID>
Click Check my progress to verify the objective.
Set up resources in the second project
Check my progress
Task 3. Log viewing and filtering in first project
See which services are writing logs
Return to the browser tab displaying the Google Cloud Console.
Verify it is still displaying project 1 (the project ID is displayed at the top of the console, it should match the GCP Project ID 1 in the Qwiklabs Connection Details).
Go to Stackdriver Logging (Navigation menu >Logging > Logs).
View the range of GCP services writing logs into Stackdriver by clicking on the first drop-down in the details pane of the window.
View VM instance logs with simple filtering
From the drop-down, select GCE VM Instance > All instance_id. Note that these logs are from all the VMs in the project.
To get a sense of possible breach attempts on your Web servers, set up your log viewer with the following settings:
Enter 403 into the filter field at the top of the window.
Place newest entries at the top by clicking on View Options and selecting Show newest logs first.
Turn on streaming logs by clicking on .
You should see new log entries showing up every 1-2 seconds as the background activity is generating unauthorized requests against your Web servers.
To get a sense of overall web activity on any Linux Apache servers…
Stop log streaming by clicking on Stop streaming logsbutton. .
Remove the 403 filter by clicking the X next to it.
Switch to viewing just the Apache access logs by clicking on All logs and selecting apache-access. Note that these entries include requests with 200, 403, and 404 responses.
To get a sense of general system activity on a given Linux server…
Switch from GCE VM Instance to GCE VM Instance, linux-server-***
Switch from All logs to syslog.
Note that you can also control log entry display by selecting log levels, log time windows, etc.
Task 4. Using Log Exports
Stackdriver Logging retains log entries for 30 days. In most circumstances, you’ll want to retain some log entries for an extended time (and possibly perform sophisticated reporting on the archived logs).
GCP provides a mechanism to have all log entries ingested into Stackdriver also written to one or more archival “sinks.” In this task you will configure and test log exports to BigQuery.
Configure the export to BigQuery
Go to Stackdriver Logging Exports (Navigation menu >Logging > Exports).
Click Create Export.
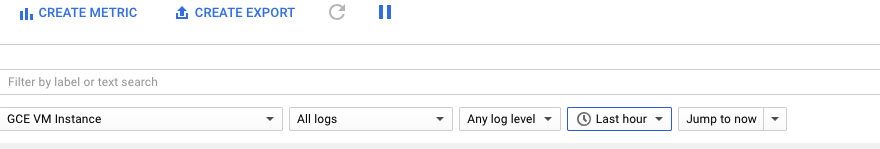
Reset the viewer to the following settings:
Verify there are no filters set. If any filters remain click the X next to them to delete them.
Set the first drop down to GCE VM Instance > All instance_id.
And then the remaining drop down menus to: All logs, Any log level, Last hour.
Verify the sorting is Newest logs first.
Your screen will look similar to:
In the Edit Export section of the window, configure the export:
Sink Name
vm_logs
Sink service
BigQuery
Sink Destination
Create new BigQuery dataset (name itproject_logs and click Create)
Click Create Sink to save your export. Click Close to dismiss the results dialog.
You will now create an export for the Cloud HTTP Load Balancer logs to BigQuery.
Click Create Export.
Reset the viewer to the following settings:
Verify there are no filters set. If any filters remain click the X next to them to delete them.
Set the first drop down to Cloud HTTP Load Balancer> All forwarding_name_rule.
In the Edit Export section of the window, configure the export:
Sink Name
load_bal_logs
Sink service
BigQuery
Sink Destination
Select the BigQuery dataset project_logs
Click Create Sink to save your export. Click Close to dismiss the results dialog.
In the Navigation menu > Logging, click on Exports, and you should now see the exports you just defined. Note the Writer identity – this is a service account used to write your log entries into the target location. This account must have permissions to update the target.
Investigate the exported log entries
Open BigQuery (Navigation menu > BigQuery). If prompted, log in with the Qwiklabs-provided credentials.
The Welcome to BigQuery in the Cloud Consolemessage box opens. This message box provides a link to the quickstart guide and lists UI updates.
Click Done.
In the left pane in the Resources section, click your project (this starts with qwiklabs-gcp-xxx) you should see a projects_logs dataset under it.
Verify that the BigQuery dataset has appropriate permissions to allow the export writer to store log entries. Click on the project_logs dataset, then click on the Share dataset. On the Dataset permission page you will see the service account as BigQuery Data Editor member. If it’s not already listed, you can add service account under Add members and grant data editor role.
Expand the data set to see the table with your exported logs (click on dataset name to expand). You should see multiple tables – one for each type of log that’s receiving log entries.
Take a moment to review the schemas and details of the tables that are being used.
Click on the requests_20190326 table, then click on the Details button to see the number of rows and other metadata about the table.
You can run all sorts of queries to analyze your archived log entries. For example, to see a breakdown of response codes issued by the global HTTP Load balancer used by your GKE cluster, paste the below query in the Query editor space and click Run (revising the table name so that it matches that shown in your BigQuery UI next to Table Details):
#standardSQLwith requests AS (
SELECT
COUNT(*) req_count
FROM
`project_logs.requests_20190326`)
SELECT
httpRequest.status AS status,
COUNT(httpRequest) AS requests,
ROUND(COUNT(httpRequest)/req_count *100,1) AS percent
FROM
`project_logs.requests_20190326`,
requests
GROUP BY
httpRequest.status,
req_count
ORDER BY
percent DESC
Feel free to experiment with some other queries that might provide interesting insights.
Click Check my progress to verify the objective.
Configure the export to BigQuery
Check my progress
Task 5. Creating Log Exclusions
The Stackdriver Logging service is free for the first 50GB of log entries ingested per project/month. For data volumes above 50GB per month, you pay $0.50/GB. Certain solution architectures can generate large volumes of log data, and thus potentially large bills for log ingestion.
Google makes it possible to exclude certain log entries so that they are not ingested and do not count against your free quota. If you exclude entries, but have an export sink enabled, the log entries will be exported and then discarded. If you do not have an export sink that catches the log entries, the data is discarded and lost.
In the next task you’ll review log ingestion and configure a log exclusion.
Review the basic interface
Go to the Logs ingestion page in the Console (Navigation menu > Logging > Logs ingestion).
Take a moment to review the following info:
This month’s ingested log volume
Projected ingestion log volume
Ingestion by service
Build an exclusion for the Cloud HTTP Load Balancer
The Cloud HTTP Load Balancer records a log entry for every request the load balancer receives. Obviously, this can generate very high volumes of log data, and it is not uncommon to exclude these from ingestion.
Click on the three-dot menu in the far right column of the Cloud HTTP Load Balancer row.
Select Disable log source, then click OK. This will exclude all log entries from this service. Alternatively, you could define an exclusion filter to exclude only some subset of entries generated by this service.
Verify that the exclusion and export are working
Return to the Logs page (Navigation menu > Logging> Logs).
Select the Cloud HTTP Load Balancer service from the first drop-down menu.
Configure View Options to Show newest logs first.
Enable log streaming. Watch for 30 seconds; you should not see any new log entries appearing.
Return to the BigQuery UI and re-run the request summary query. The request numbers should be significantly larger. If you re-run the query a few times at 5 second intervals, you will see the requests are indeed being recorded into BigQuery even though they aren’t being ingested into Stackdriver.
Task 6. Creating a Logging Metric
Stackdriver allows you to create custom metrics based on the arrival of specific log entries. In this task, you will create a metric that you can use to generate alerts if too many web requests generate access denied log entries.
Navigate to the Logs-based metrics page in the console (Navigation menu > Logging > Logs-based metrics).
Start defining the metric by clicking CREATE METRIC.
Create a simple filter, selecting the GCE VM Instanceservice from the first drop-down menu, and enter 403into the filter field. Press ENTER to apply the filter.
In the Metric Editor section of the window, enter the following information:
Name
403s
Type
Counter
Click the Create Metric button.
You will make use of this metric in the dashboarding and alerting portion of the lab.
Click Check my progress to verify the objective.
Create a logging metric
Check my progress
Task 7. Creating a Stackdriver account
A single Stackdriver account is used to monitor resources in one or more projects and AWS accounts, providing a single “pane-of-glass” for management.
Typically, you create a project just to hold the Stackdriver account configuration data. When you create the Stackdriver account from within that project, you can associate other GCP projects with the account, allowing for the one account to manage resources across multiple projects. You can also associate AWS accounts with the Stackdriver account, and any resources owned by those accounts will also be managed by the single Stackdriver account.
In this task, you will create and configure a Stackdriver account for use across your projects.
Switch to the third project created by Qwiklabs (use the GCP Project ID 3 from the Qwiklabs Connection Details).
Open Stackdriver Monitoring (Navigation menu >Monitoring).
Click Create Workspace, if you see your project inGoogle Cloud Platform project box.
When prompted, select the other two Qwiklabs-created projects, and click Continue.
You will not be adding any AWS accounts, so click onSkip AWS Setup.
The next screen offers direction on how to install the Stackdriver monitoring agents. This has already been done on your VMs. Click Continue.
On the Get Reports by Email screen, select No reportsand click Continue.
Wait until the Launch monitoring button becomes active, then click it to enter into the Stackdriver monitoring UI.
Task 8. Creating a Stackdriver dashboard
In the left pane, click Dashboards > Create Dashboard.
Click Untitled Dashboard, type Example Dashboard, and press ENTER.
Click ADD CHART.
For Title, give your chart a name of CPU Usage.
For Find resource type and metric, type GCE VM and select GCE VM Instance.
For Metrics, select CPU usage.
Click SAVE to add this chart to your dashboard.
Click the ADD CHART button again.
Name the chart Network Traffic and set the metric toGCE VM Instance > Network Traffic.
Explore the other options, such as Filter, Group By, and Aggregation.
Click SAVE to add this chart to your dashboard as well.
Task 9. Finish up
Review
In this lab, you had the chance to do the following:
View logs using a variety of filtering mechanisms
Exclude log entries and disable log ingestion
Export logs and run reports against exported logs
Create and report on logging metrics
Create a Stackdriver account used to monitor several GCP projects
Create a metrics dashboard
Also, keep in mind that Stackdriver can collect logs and metrics data from non-GCP systems. Google provides Stackdriver agents that can be installed on AWS EC2 instances, and you can install fluentd and collectd agents on on-premise machines, enabling them to write data to the Stackdriver service.
Task 1. Configure service accounts and role assignments
It’s a best practice to create service accounts for your VMs, and to assign those accounts the minimal set of roles required for the VMs to perform their jobs. In this task, you’ll create two service accounts (one for Linux VMs and one for Windows VMs) and assign them only the roles required to write log entries and metrics data into Stackdriver.
Select Service accounts in the Google Cloud Console (Navigation menu > IAM & admin > Service accounts).
Click CREATE SERVICE ACCOUNT. This account will be used by your Linux VM.
Name the service account linux-servers.
Assign the Logging > Logs Writer role to the service account.
Assign the Monitoring > Monitoring Metric Writer to the service account.
Save your new service account.
Repeat the process, creating another service account named windows-servers, assigning the same roles. This account will be used for the Windows VM you create.
Click Check my progress to verify the objective.
Configure service accounts
Check my progress
Task 2. Create the VMs
In this task, you’ll create one Linux VM and one Windows VM. You will configure each VM to use an appropriate service account that will allow the installed agents to write their data to Stackdriver. The Linux VM will also have Apache2 installed to show how the logging agent acquires 3rd-party application logs.
Create Linux VM
Select VM instances in the Google Cloud Console (Navigation menu > Compute Engine > VM instances).
Click Create to create your Linux VM.
Configure your VM with the following settings (leave other settings at defaults):
Property
Value
Name
linux-server
Region
us-central1
Zone
us-central1-a
Identity and API access > Service account
linux-servers
Allow HTTP traffic
Enabled
Click Management, security, disks, networking, sole tenancy.
Paste the following code into the Startup script field. This script will install the Apache web server on your VM:
#!/bin/bash
if [ ! -f /initialized.txt ]; then
    apt-get update
    apt-get install -y apache2
    touch /initialized.txt
fi
Click Create.
After the green checkbox appears next to your instance, wait another 30-60 seconds. Click on the external IP address assigned to your linux-server VM. This should open a new tab and show the Apache2 default page.
Create Windows VM
In the VM instances page, click CREATE INSTANCE to create your Windows VM.
Configure your VM with the following settings (leave other settings at defaults):
Property
Value
Name
windows-server
Region
us-central1
Zone
us-central1-a
Boot disk
Window Server version 1803 Datacenter Core
Identity and API access > Service account
windows-servers
Allow HTTP traffic
Enabled
Click Create.
You may continue on to Task 3 while the Windows VM finishes starting.
Click Check my progress to verify the objective.
Create the VMs
Check my progress
Task 3. Install, configure, and test logging agents
In this task, you will install the Stackdriver logging agent on each VM. You will check the VM logs before and after agent installation to see how installing the agent results in more logs being recorded.
Investigate log entries before agent installation
Go to Logging in the Google Cloud console (Navigation menu > Stackdriver > Logging).
Using the first drop-down, select GCE VM Instance as the log resource category.
Using the second drop-down, view the log types available. Leave the selection as All logs.
Note the current log entries. There are only audit log entries, detailing actions such as creating the VMs. There are no syslog entries, Apache log entries, etc.
Install the Stackdriver Logging agent on Linux server
Return to the VM instances page in the console, and SSH into the linux-server instance by clicking the SSH button in the Connect column.
Check to see what version, if any, of the logging agent is installed by entering
dpkg -l google-fluentd
You should see that the package isn't installed.
Install the agent and verify installation by entering
Check to see what version, if any, of the logging agent is installed by entering
dpkg -l google-fluentd
You should see that the package is now installed.
Close the SSH window.
In the VM instances window, select the linux-serverand reset the instance.
Configure remote Windows management
In your Qwiklabs user Chrome window, install the Chrome RDP for Google Cloud Platform application (https://goo.gl/ZabJn6).
In the VM instances screen, click the drop-down next to RDP in the Connect column of the VM listing; selectSet Windows password.
In the Set new Windows password modal dialog, clickSet. Note the password as you’ll need to use it later (you can copy/paste into a text editor or note-taking app, or write it down).
Install the Stackdriver Logging agent on the Windows server
Click on the RDP button for your windows-serverinstance.
When prompted, provide the Windows password and click OK.
If prompted that the server certificate cannot be verified, click Continue to connect.
Open Powershell by entering the following at the Windows command prompt:
powershell
In Powershell, enter the following to download and install the agent:
Download and activate Stackdriver’s Apache monitoring plugin.
cd /opt/stackdriver/collectd/etc/collectd.d/
sudo curl -O https://raw.githubusercontent.com/Stackdriver/stackdriver-agent-service-configs/master/etc/collectd.d/apache.conf
sudo service stackdriver-agent restart
Close the SSH window
Install the Windows monitoring agent
From the VM instances window, click on the RDP button for your window-server instance.
When prompted provide the Windows password you noted earlier.
Start Powershell
powershell
In Powershell, enter the following to download and install the agent:
Follow the Stackdriver installer prompts, accepting all the default values.
Click on the down arrow at the top of the RDP window, and select Ctrl+Alt+Del.
Choose Sign out and close the Chrome RDP window.
Verify that the monitoring agents are generating metrics
The Apache plugin monitors the following metrics:
Active Connections (count): The number of active connections currently attached to Apache.
Idle Workers (count): The number of idle workers currently attached to Apache.
Requests (count/s): The number of requests per second serviced by Apache
In the GCP console window, navigate to the Monitoring screen (Navigation menu > Stackdriver > Monitoring).
If ask select your Qwiklab account. In the Create your free Workspace screen, click the Create workspacebutton. This will create a new Stackdriver monitoring workspace. A single Stackdriver workspace can contain multiple GCP project and provide a “single pane of glass” to monitor all resources.
On the Add Google Cloud Platform projects to monitorscreen, click the Continue button.
Click the Skip AWS Setup button. We will not setup AWS monitoring, but there are Stackdriver monitor agents available for AWS as well.
On the Install the Stackdriver Agents screen, clickContinue. You have already done this.
On the Get Reports by Email screen, for this lab clickNo reports and click Continue. In your actually account you may want to receive email reports.
Wait a minute while Stackdriver monitoring configures and then click Launch Monitoring.
Under Monitoring Resources, click on Resources. You should see Apache HTTP server under HOST:
Click on Apache HTTP server and then click on thelinux-server instance in the resulting screen.
Explore the metrics and information displayed for the Apache server.
Click Check my progress to verify the objective.
Install, configure, and test logging and monitoring agents
 )to open Cloud Shell. If prompted, click Start Cloud Shell.
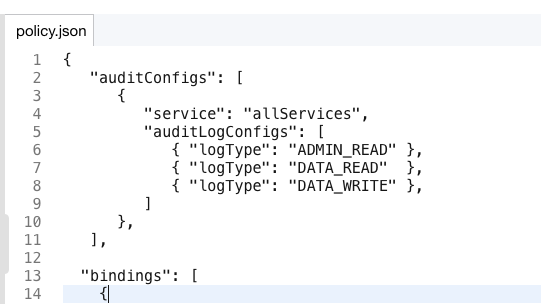

 for your export and select View Filter.
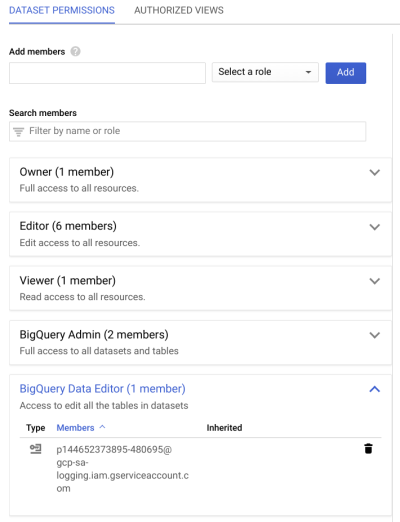
 .
. .
.